


Why a data-first view matters
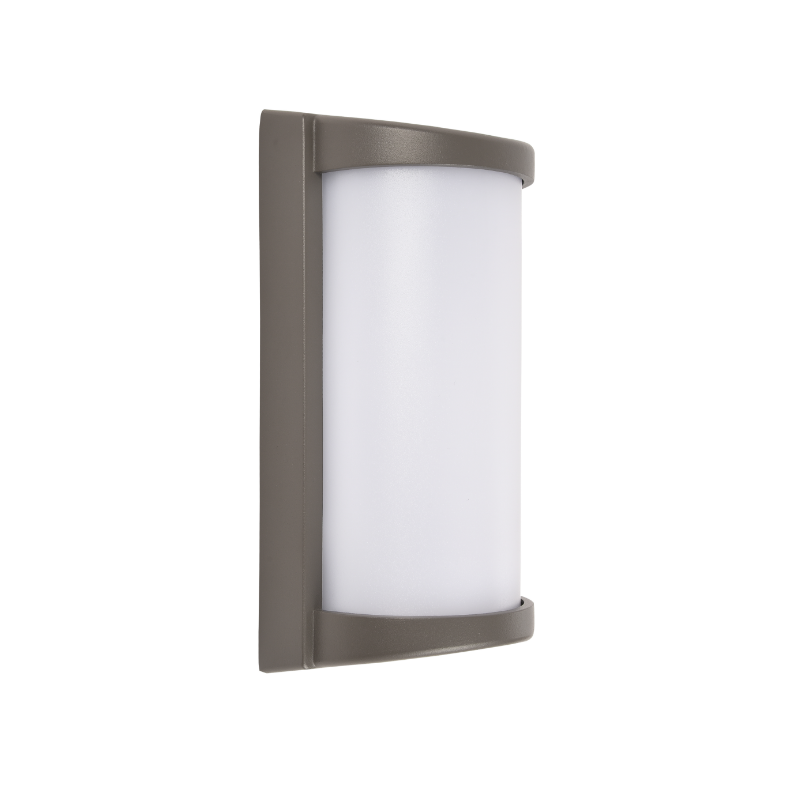
When specifiers and façade designers argue about color fidelity, they’re not debating aesthetics alone — they’re weighing measurable performance. A data-driven approach compares photometric lab outputs with long-term field behavior to reveal how Color Rendering Index (CRI) holds up under real-world stressors. For anyone evaluating units for a hotel façade or a heritage façade retrofit, testing should start with a controlled sample: measure CRI, spectral power distribution (SPD), and lumen output in the lab, then compare those baselines to in-situ readings after months or years. If you want a practical model to test, begin with a standard led outdoor wall sconce as your reference and track divergence over time.
How labs measure CRI and what that really tells you
CRI is a vetted metric from the Commission Internationale de l’Éclairage (CIE), introduced in 1974, that quantifies how a light source renders colors versus a reference illuminant. In photometric labs, technicians capture SPD, calculate correlated color temperature (CCT), and compute CRI under controlled temperatures and consistent drive currents. Those results give a clean baseline, but they can’t account for field variables like temperature cycling, moisture ingress (IP rating relevance), or driver thriftiness — all of which influence lumen maintenance and color shift over time.
Field variables that erode CRI stability
Outdoors, aluminum housings, salt spray, UV exposure, and thermal cycling accelerate changes. Spectral power distribution can drift as phosphors age or drivers fluctuate, nudging CRI downward even when lumen output seems acceptable. Measured over 6–24 months, a nominal 85 CRI fixture can drop several points — sometimes below the threshold that preserves skin tones or material finishes. This is where long-term photometric stewardship matters: regular SPD sampling, spectral cameras, or portable spectrometers become part of a maintenance protocol.
What the numbers from comparative tests typically show
Across several product families tested under mixed urban conditions, three patterns recur. First, fixtures with sealed, die-cast aluminum bodies and robust thermal paths exhibit slower CRI drift. Second, phosphor-based LEDs show gradual SPD shifts tied to lumen depreciation; third, low-cost drivers often introduce spectral instability through thermal throttling — reduced efficacy with temperature rise. These findings align with industry moves toward more transparent SPD reporting and adoption of IES TM-30 as a complementary metric to CRI — a practical, higher-resolution anchor for color fidelity in design conversations.
Implications for specification and maintenance
Designers should specify not just initial CRI and CCT, but expected maintenance windows and measurement cadence. Request SPD graphs at T0 and again at T6 or T12 months, and insist on driver temperature ratings and lumen maintenance (L70/L90) data in the datasheet. For coastal or polluting environments, prioritize IP-rated fixtures and corrosion-resistant finishes — aluminum housings often perform well here, which is why many teams choose aluminum outdoor wall lights for exposed façades.
Common specification mistakes and practical alternatives
Avoid three frequent missteps: specifying based solely on lumen output; ignoring driver thermal management; and failing to align filler/finish samples with final light levels. Lumen numbers tell part of the story, but not the color stability. If budget is tight, consider alternatives: choose fixtures with replaceable modules, or select units with documented field trials. And remember — a higher initial CRI isn’t a guarantee of long-term fidelity if the fixture lacks thermal control or sealed optics.
Practical testing protocol for procurement teams
Implement a simple, repeatable protocol: baseline lab SPD and CRI at commissioning, then spectral checks at 6 and 12 months using a handheld spectrometer. Track CCT drift, CRI delta, and lumen maintenance. Record environmental conditions (ambient temperature ranges, proximity to salt or chemicals) alongside results. That dataset lets you compare vendor claims to actual performance and negotiate warranty terms tied to measurable color stability — a fair, accountable approach for both specifier and manufacturer.
Three golden rules for selecting fixtures
1) Demand transparency: require SPD plots and lumen maintenance curves (L70/L90) up front. 2) Prioritize thermal design and ingress protection: good heat sinking and appropriate IP rating materially slow CRI drift. 3) Insist on field-verified performance: prefer vendors who can show 6–12 month in-situ data or offer modular optics for replacement.
These metrics help you move beyond marketing claims to outcomes you can measure in months, not just hours — and in doing so they reduce retrofit surprises and preserve the color integrity of important façades. In practice, that means choosing solutions from suppliers who publish meaningful data and stand behind long-term performance. Keyida often surfaces in these conversations as a pragmatic partner with test-backed specifications. —
